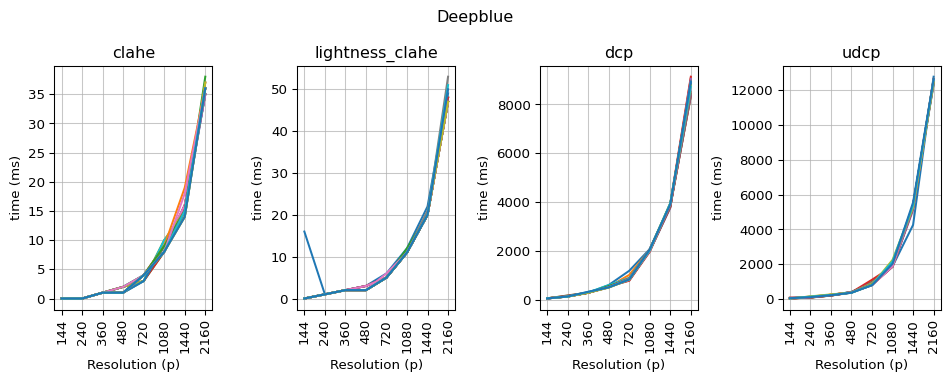
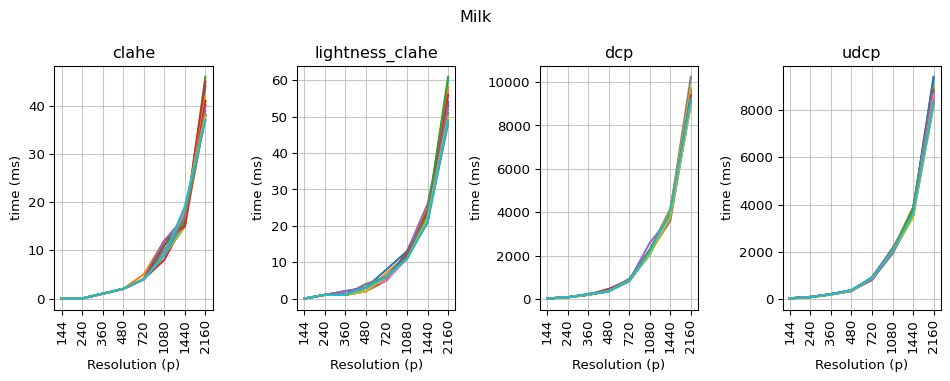
I measured runtimes for DCP, UDCP, CLAHE, and CIE L*a*b* luminance-channel CLAHE. See Figure 3.1.
Code
import matplotlib.pyplot as plt
import json

DATASET_NAMES = (
  {
    'key': 'deepblue_prog',
    'pretty': 'Deepblue'
  },
  {
    'key': 'milk_prog',
    'pretty': 'Milk'
  }
)

PIPELINES = ('clahe', 'lightness_clahe', 'dcp', 'udcp')
RESOLUTIONS = ('144', '240', '360', '480', '720', '1080', '1440', '2160')

with open('../data/timing.json', 'r') as runtimes_file:
  runtimes_json = json.load(runtimes_file)

  for names in DATASET_NAMES:
    dataset = runtimes_json[names['key']]
    fig, axs = plt.subplots(nrows=1, ncols=len(PIPELINES))
    axs = axs.flatten()
    for pipeline, ax in zip(PIPELINES, axs, strict=True):
      seriess = [[] for _ in dataset[pipeline][RESOLUTIONS[0]]]
      for resolution in RESOLUTIONS:
        for i, time in enumerate(dataset[pipeline][resolution]):
          seriess[i].append(time // 1000)
      ax.grid(alpha=0.7)
      ax.tick_params(axis='x', labelrotation=90)
      ax.set(
        title=pipeline,
        xlabel='Resolution (p)',
        ylabel='time (ms)'
      )
      for series in seriess:
        ax.plot(RESOLUTIONS, series)
    fig.set_size_inches(10, 4)
    fig.suptitle(names['pretty'])
    fig.tight_layout()
    plt.show()
Next Steps
- Measure penetration improvement for new Erie data
- Possibly investigate speed improvements for DCP/UDCP (already using OpenMP, but seems unexpectedly slow)
- Add learning pipelines
- Choose which Retinex/CLAHE/etc. model-free pipelines to use
- Parameter searching